
How to Look Up Providence County Jail Population Data
The official source is the Rhode Island Department of Corrections. RIDOC publishes annual population reports that cover facility data, total population trends, offender characteristics, and pretrial and sentenced counts. The most recent reports, for fiscal years 2024 and 2023, are the best place to start for hard numbers.
Because Rhode Island reports at the state level, you will not find a Providence County line item. Instead, read the statewide ACI data and remember that Providence County cases feed into it. Individual facility pages also show current snapshots, like capacity and average population.
So the search has two layers. For a current snapshot of one building, read the facility page. For the full system over a year, read the annual report. Both are official. Pick the one that matches the question you are trying to answer.
Why There Is No Providence County Jail Population
This is the central point. Rhode Island does not run county jails. The ACI in Cranston is the statewide jail and prison system. So a phrase like "Providence County jail population" is misleading if read like a county jail page. The right framing is that Providence County arrests and court commitments enter the state ACI system.
The ACI sits close to Providence County, and it receives detainees from across the state. That keeps the data centralized. It also means trend analysis works best at the state level, with county context drawn from outside research groups rather than a county jail report.
ACI Facility Capacity Overview
RIDOC names several secure facilities within the ACI: the Intake Service Center, High Security, Maximum, Medium, Minimum, and the Women's Facility. Each has its own page with current capacity and population data. The clearest inspected example is the High Security Center.
| Facility | Data Status | Capacity / Population |
|---|---|---|
| High Security Center | Facility page inspected | Bed capacity 166; FY24 average about 80; FY24 operational capacity 96 |
| Intake Service Center | Named ACI facility | See RIDOC annual report |
| Maximum Security | Named ACI facility | See RIDOC annual report |
| Medium Security | Named ACI facility | See RIDOC annual report |
| Minimum Security | Named ACI facility | See RIDOC annual report |
| Women's Facility | Named ACI facility | See RIDOC annual report |
The full facility-by-facility numbers come from the RIDOC annual reports, which update each fiscal year. Capacity is not one fixed number either. A facility has a bed capacity, an operational capacity, and an actual population, and the three can differ. The High Security Center shows all three, which is why it is a useful model for reading the other ACI facilities.
High Security Center Example
The High Security Center page gives a concrete, current snapshot. It lists a bed capacity of 166, a fiscal year 2024 average facility population near 80, and an operational capacity of 96 for the same year. The facility opened in 1981.
The same page reports an annual cost per offender of $258,220. That figure shows how expensive close-custody housing is. The center holds people who need close control and includes a Rehabilitation Treatment Unit as an alternative to more restrictive housing. Cost per offender is a useful lens, because close-custody beds cost far more than lower-security ones, which is part of why classification and housing decisions matter so much.
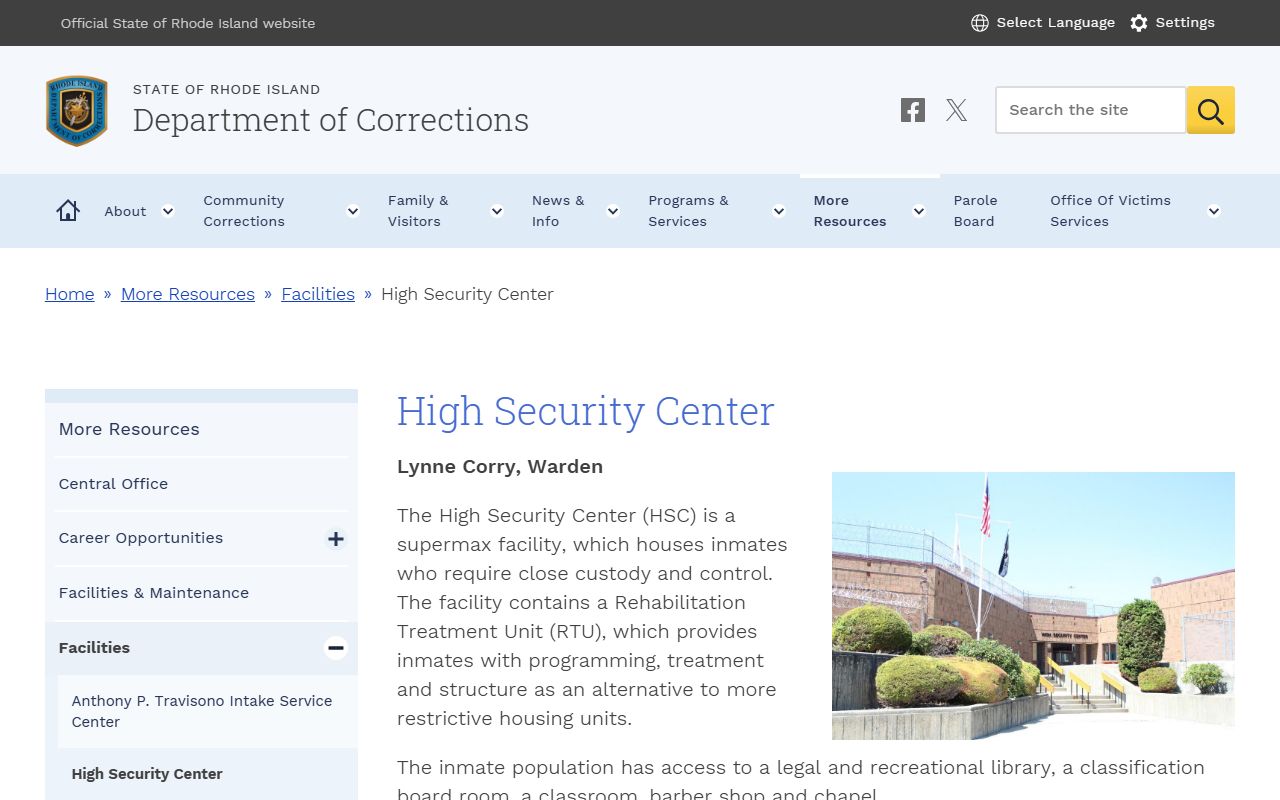
The High Security Center page is the source for the capacity, population, and cost figures noted here.
Average Daily Population
Average daily population, or ADP, is the everyday measure of how full a system is. It smooths out the daily ins and outs into one number. For the High Security Center, the FY24 average sat near 80 against a bed capacity of 166, so the facility ran below its bed count that year.
For the whole ACI, the RIDOC annual reports carry the statewide ADP across all facilities. Read those reports for the current total, since the number shifts year to year. A single facility snapshot does not represent the entire state system.
ADP is more useful than a one-day count. A daily headcount can spike or dip for short reasons, like a weekend or a court recess. The average across a year evens those out and gives a fairer read on how the system runs.
Pretrial vs Sentenced Population
The ACI holds two broad groups. Pretrial detainees are held while a case is pending and not yet resolved. Sentenced inmates are serving a term after a conviction. Because Rhode Island runs a unified system, both groups sit within the same ACI complex rather than in separate county jails and state prisons.
| Group | Who They Are | Where Counted |
|---|---|---|
| Pretrial | Held while a case is pending | ACI, in RIDOC reports |
| Sentenced | Serving a term after conviction | ACI, in RIDOC reports |
The split between the two appears in the RIDOC annual population reports. It matters because pretrial detention reflects bail and case timing, while sentenced counts reflect convictions and sentence length.
The mix shifts with policy and case flow. When bail practices or court schedules change, the pretrial share can move even if total commitments hold steady. That is one reason the annual report breaks the two apart rather than reporting a single lump count.
Misdemeanor vs Felony Population
Offense level shapes who is in custody and for how long. Misdemeanor cases in Rhode Island carry up to one year and fines up to $1,000, and many resolve quickly. Felony cases run through Superior Court and can carry longer terms, so felony commitments weigh more heavily on the sentenced population.
The RIDOC reports include offense characteristics that reflect this divide. A short misdemeanor hold affects the pretrial and short-term counts, while felony sentences drive the longer-term population. The arrest records page explains how the two offense levels move through the courts.
Mental Health and Medical Population
Custody is not only about security. RIDOC's classification process weighs medical and mental health needs when it places a person. The classification page lists health and program factors as part of where someone is housed. So part of the population is grouped by treatment need, not just offense level.
The High Security Center, for example, includes a Rehabilitation Treatment Unit as an alternative to more restrictive housing. That shows how the system blends custody and care. Detailed health-population figures sit in the RIDOC annual reports rather than on a single facility page.
Demographic Breakdown
RIDOC annual reports include offender characteristics, which cover the demographic profile of the population. That data is published at the state level, not by county of arrest. So the breakdown describes the ACI system as a whole.
For county-level context, outside research groups help. The Vera Institute and the Prison Policy Initiative both publish state and county incarceration data. Because Rhode Island centralizes custody, those county figures should be read as context, not as a separate Providence County jail count.
When you cite a demographic figure, name the source and the year. A research-group estimate and an official RIDOC count are not the same thing, and mixing them can mislead. The honest approach is to label each number clearly so a reader knows where it came from.
State and National Context
To compare Rhode Island with other places, use national data sources. The Bureau of Justice Statistics publishes national and state incarceration figures. The Prison Policy Initiative Rhode Island profile gathers state-level data in one place. These help you read the ACI numbers against the rest of the country.
| Data Level | What It Covers | Source |
|---|---|---|
| Facility | One ACI building's capacity and population | RIDOC facility pages |
| State | Whole ACI system trends | RIDOC annual reports |
| National | State-to-state comparisons | BJS and Prison Policy Initiative |
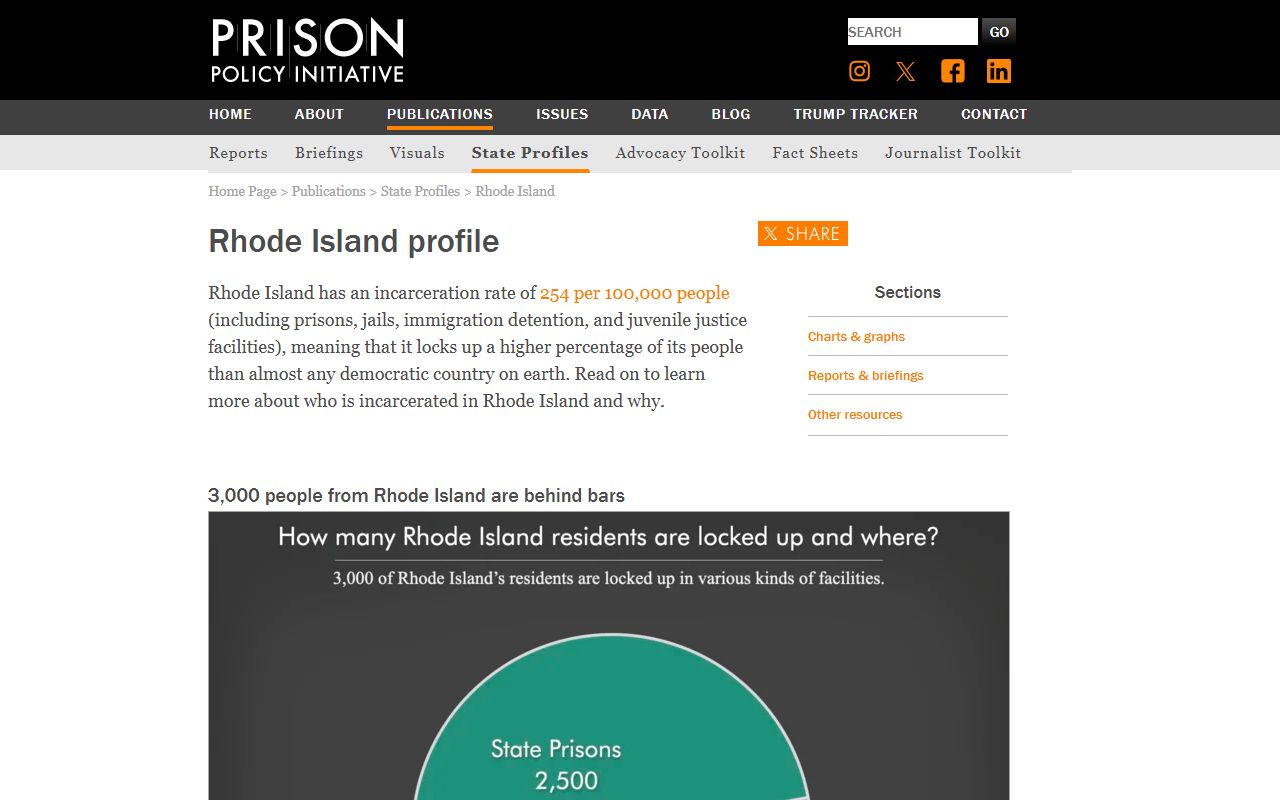
The Prison Policy Initiative profile is a useful context source alongside the official RIDOC reports.
Population Trends Over Time
Trends are best read across several years. The RIDOC annual reports include total population trends, release statistics, and projections. Comparing the FY2023 and FY2024 reports shows the direction of change. A single year can mislead, so a multi-year view is stronger.
Use the same source year over year for a fair comparison. Mixing a facility snapshot with a statewide report can distort the picture. When timing matters, note the fiscal year on each number you cite.
National trend sources add depth. BJS jail and prison reports track how the whole country moves, which helps you see whether Rhode Island follows or bucks a national pattern. The Vera Institute also offers incarceration-trend data, with the caveat that Rhode Island's centralized system limits county-by-county breakdowns.
Searching for Providence County Inmate Records by Name
This page covers population data, not individual lookups. To find one person, use the inmate records page, which explains the RIDOC inmate search. Population figures and name searches are two different tasks, so use the right tool for each. A name search answers "where is this person," while population data answers "how full is the system."
Where the Data Comes From
The numbers on this page trace to official and research sources. RIDOC facility pages and annual reports are the official record. BJS and the Prison Policy Initiative add national and state context. Each number should be read with its source and fiscal year in mind.
Note: Rhode Island reports incarceration data at the state level, so treat any county figure as context, not as a separate Providence County jail count.